If you were to gain 85% in property value, and then lose 10%, would you still consider it a bad investment?
So far, 2018 has been an interesting ride for the Australian property market, and none more so than our beloved Sydney.
If recent press coverage is anything to go by, the conditions of Sydney’s property market are on the decline. Each week, we hear reports of sluggish auction clearance rates, increased ‘days on market’, uninspiring auction attendee numbers, and a plethora of ‘experts’ tipping prices to plummet as the year progresses.
However, for those in the know, the negative property ‘noise’ is masking a reality that is a lot more nuanced.
The Cycle
Chances are, if you’ve ever done any research into the property market, you will have come across the concept of the property ‘cycle’. The specifics will vary depending on who you ask, but essentially the concept states that within a given market, house prices rise, fall, stabilise and then rise again.
And then, that cycle repeats.
Here’s a bit more detail on the different phases:
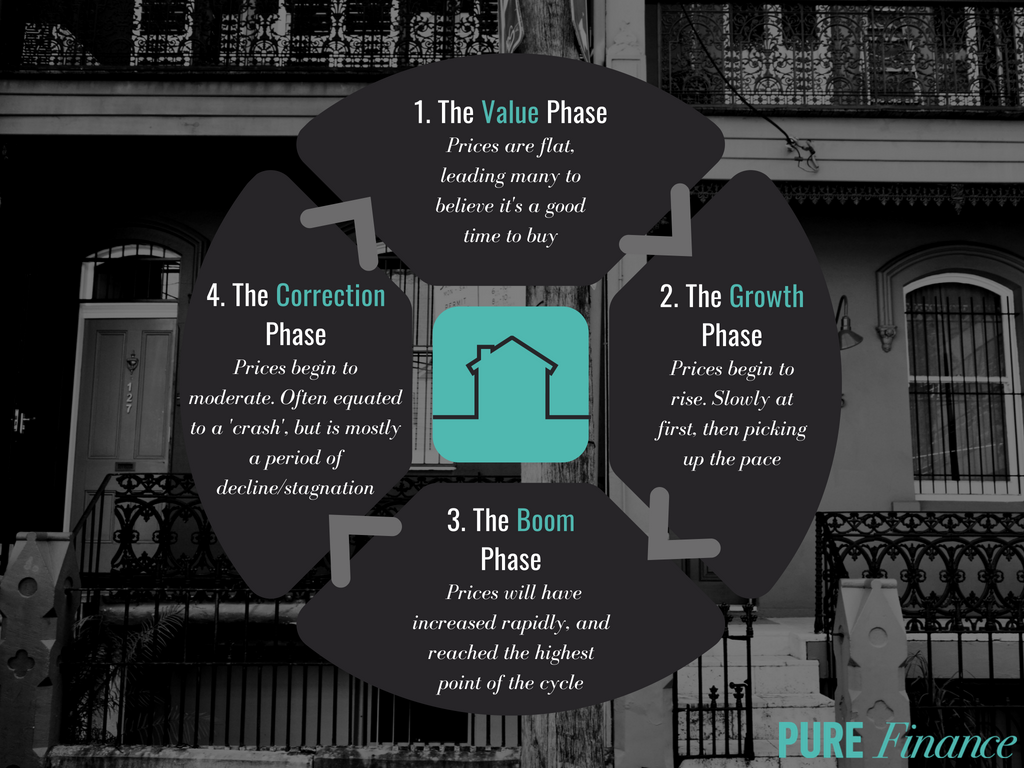
You would think then, that this formula would make property investment a breeze. However, the length of each phase and the rate at which they progress is incredibly hard to pick (we’d say, almost impossible) and generally, we can only identify a phase change until after the fact. This theory is further backed up by the often-conflicting predictions made by economists and experts.
Keeping all that in mind, it may be observed that Sydney has entered a correction phase, which broadly means: a buyer’s market.
Sydney: Everything old is new again
There is no doubt, things have definitely slowed in Sydney in some areas.
Although, for many potential home seekers, this hasn’t necessarily correlated with an easier ride. Even with the current overall market ‘softening’, as of July 2018, Sydney’s median house price was still an incredible $1,114,000 with national dwelling values still 32.4% higher than they were five years ago.
Having said that, we have seen a drop in Sydney values overall, which was at -0.6% for the June quarter and -7.4% for the last 12 months, with prices forecasted to fall further for the remainder of the year. In his recently revised 2018 forecast, SQM’s Louis Christopher predicts this will equate to between -4% - 0%.
The ‘Correction’ phase
After the astronomical growth Sydney experienced between 2012-17, which saw prices rise by a whopping 85%, even a modest price correction could be considered a ‘stark’ contrast. However, we are much more interested in specifics.
There are a few factors contributing to Sydney’s recent slowdown:
- The tightening of lending criteria + affordability constraints (aftershocks of the royal commission)
- Less investment activity
- Weak household income growth
- Potential increase of interest rates
- An increase in the supply of properties for sale
The real question is, when will we hit the bottom of this correction, and how bad will the damage be? It’s impossible to say for sure, but experts are predicting the damage to be minimal, with prices due to start rising again, showing another 3% of growth, into 2021.
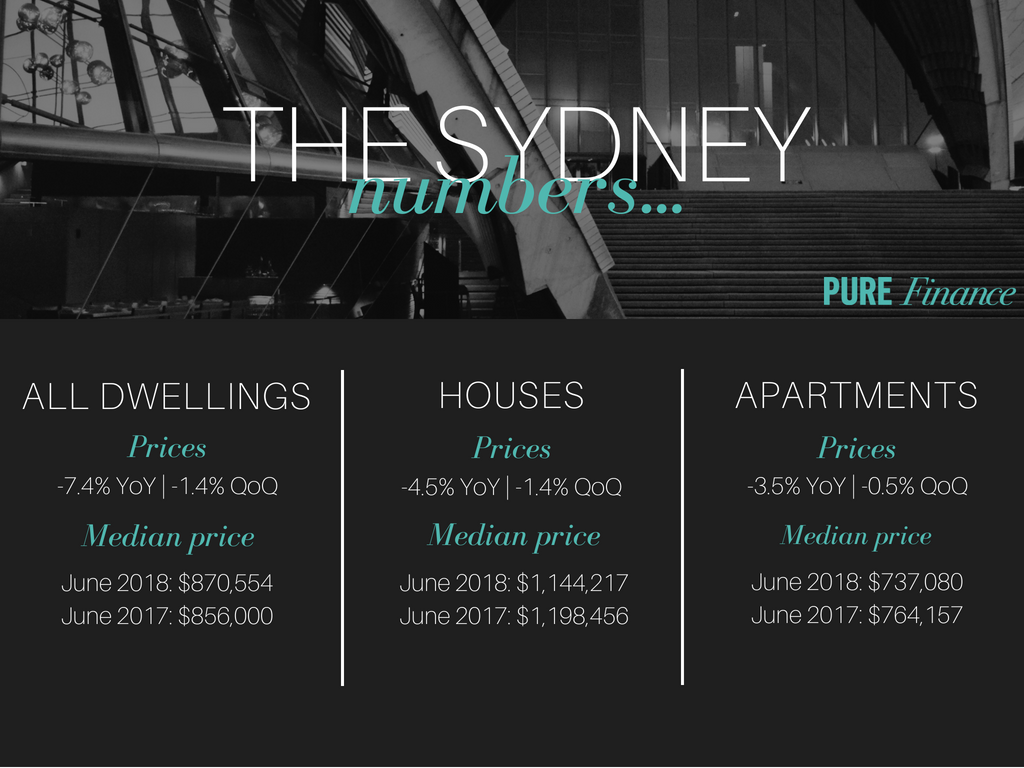
Now, let’s get specific!
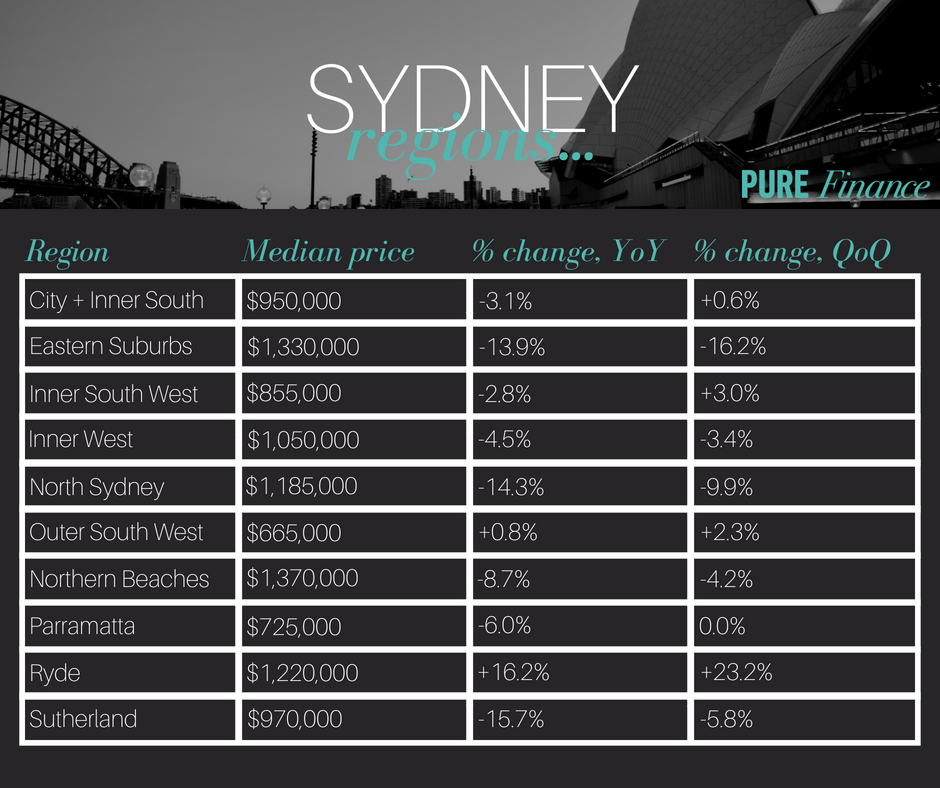
While Sydney recorded an overall drop in values, there were still some pockets that experienced growth. The breakdown below takes an in-depth look at the % change that has occurred in overall values in Sydney, on a regional level.
Sydney property growth % change by region
Nuanced neighbourhoods
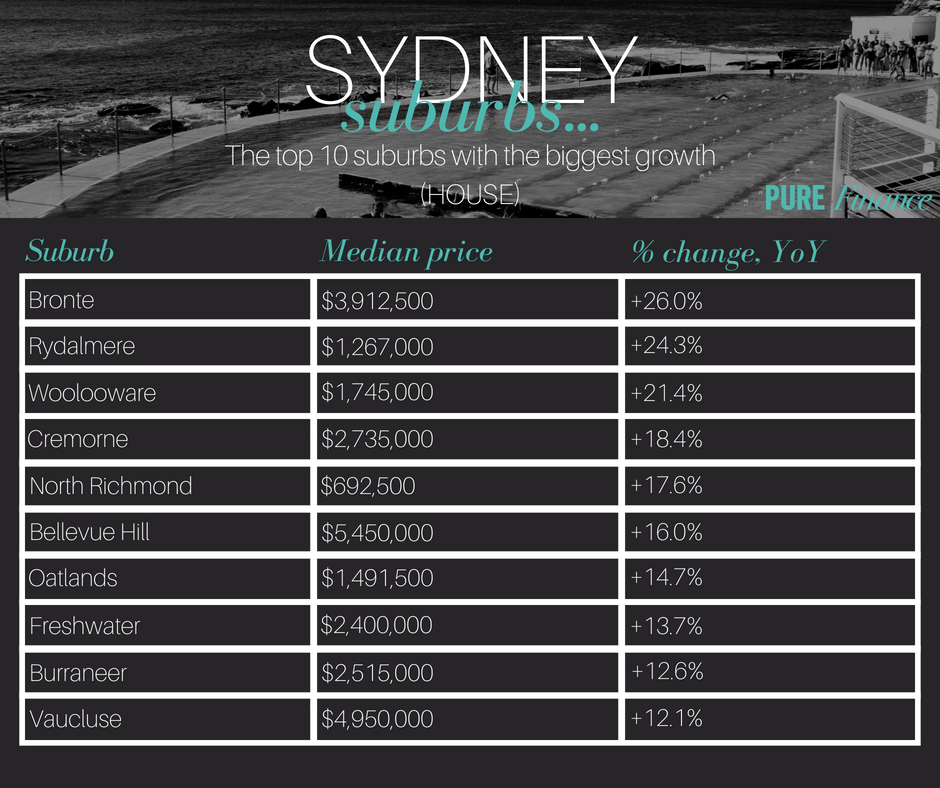
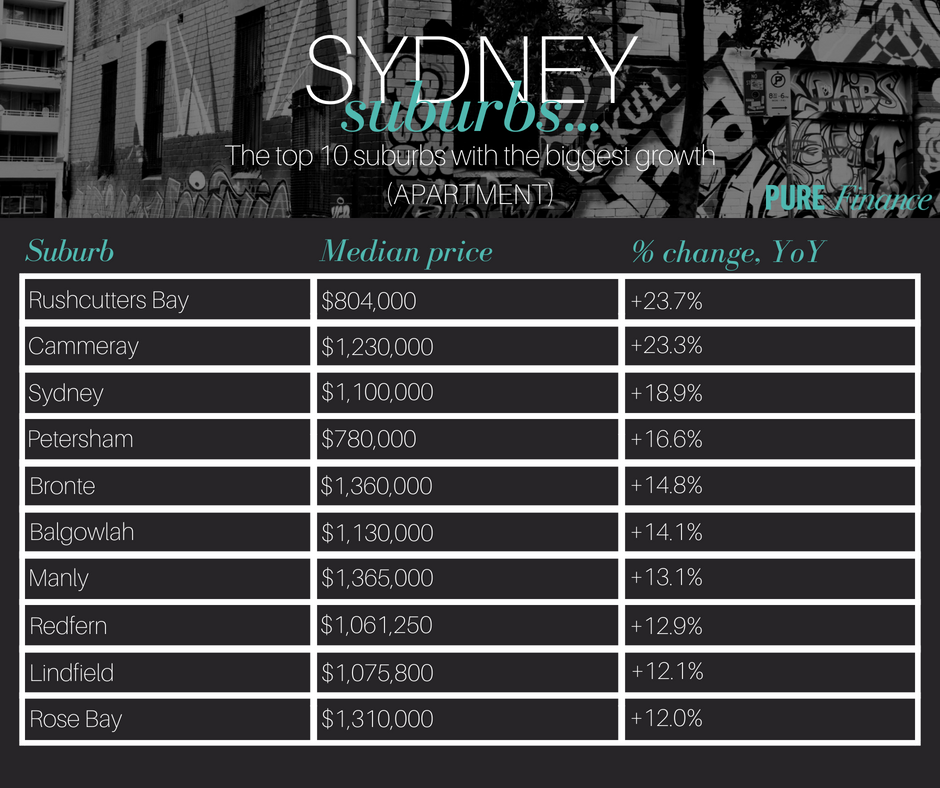
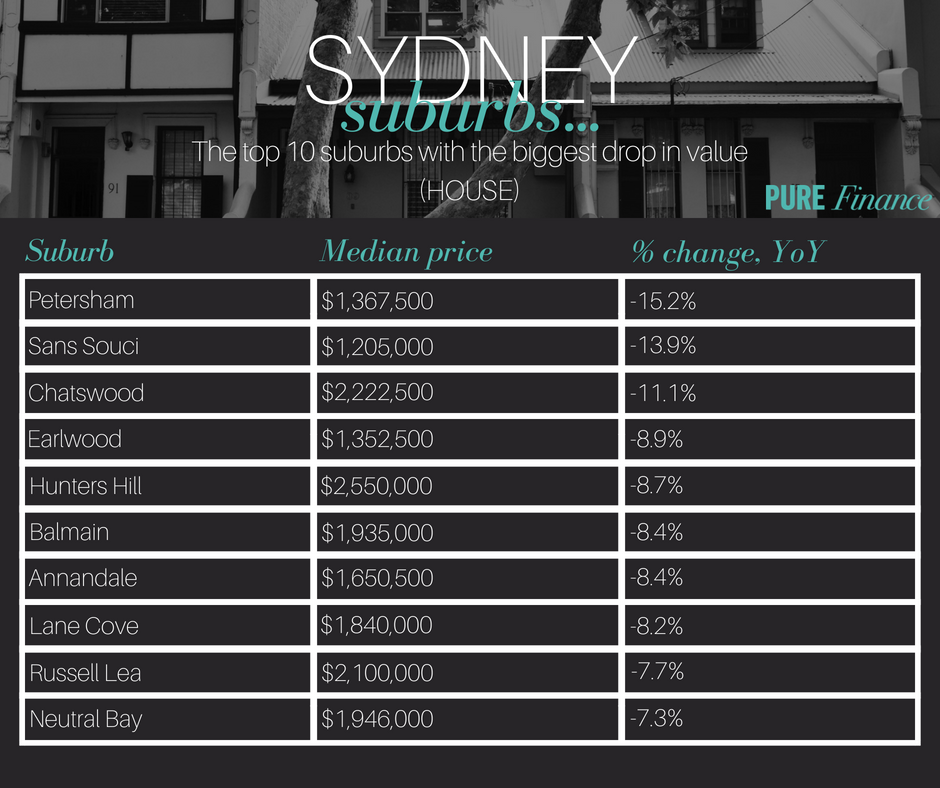
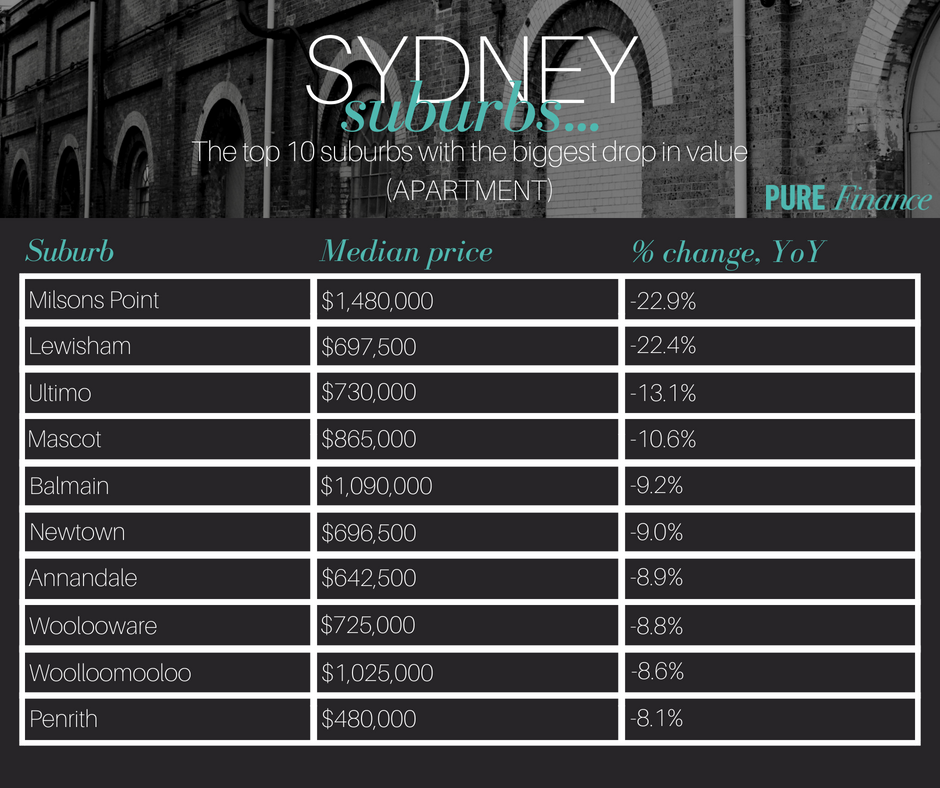
A general view of the Sydney market will only give you a small piece of the puzzle, so let's narrow it down even further with Sydney’s 10 best (and not so best) performing suburbs.
The results may surprise you!
The Best: Sydney property growth % change by suburb
The Worst: Sydney property growth % change by suburb
A word on the national numbers
National property prices peaked in September last year and have since fallen 1.3% to a median of $556,384. Despite this, national property prices are still 32.4% higher now compared to five years ago.
On an interesting note, Core Logic chief economists found that over the past 12 months the most expensive end of the market fell 3.6%, while the least expensive end of the market recorded a 1.4% gain. This is most likely due to the increase in first home buyer activity propping up the lower end of the market.
These differences were even more pronounced in Sydney and Melbourne - with their priciest homes falling 7.3% and the cheapest rising 2.5%.

In our opinion
If there is anything to be taken from the recent market speculation it is that context is crucial. It’s one thing to say that Sydney house prices have dropped by -7.4%, however, given that said drop was preceded by a 5-year growth period of a staggering 85%, it tends to lend a slightly different implication to that drop.
It’s also important to remember that forecasting is exactly that: an educated guess as to what the market will get up to in the future. Given the near impossibility to predict the different phases of the property cycle, there can’t ever be a ‘right time’ to buy property. At least not one that can ever be pinned down.
Our suggestion: Educate yourself and make research driven decisions. As with any investment, it’s important that you seek accurate information derived from research, rather than hype inducing media reports.
There is one factor, however, that will always ensure value gains, and that is: time
A thoroughly researched property purchase combined with long term hold plans and a well-structured mortgage is about as fool proof as it gets. Time will do the rest.
We think there will always be value to be found in the property market. You just have to know where to look.
The preceding report was written by Pure Finance, with data collected from the following sources, unless otherwise quoted: Domain group, Realestate.com.au, SQM research, Core Logic.
